Story Points: The Complete Guide to Agile Estimation Units
Story points are a relative unit agile teams use to size backlog items by overall effort - complexity, volume of work, and uncertainty combined. Instead of predicting hours, the team compares each item to work it has already done: "this is about as hard as that."
That one sentence hides most of what teams get wrong. Points that work feel like a shared language; points that don't feel like bureaucratic guessing. The difference is rarely the scale itself - it's whether the team understands what the numbers measure, anchors them to real work, and resists the temptation to treat them as promises.
This guide covers the whole system: what points measure, where they came from, how to run your first estimation session, how to keep the scale honest as the team changes, and when to skip points entirely.
What story points actually measure
A story point has no unit. A 5-point story is not "5 hours" or "5 days" - it is roughly bigger than the team's 3s and smaller than its 8s. Three ingredients feed the number:
- Complexity - how hard the work is to think about. A one-line change to a payment processor can be more complex than 500 lines of CRUD.
- Volume - how much routine work there is. Twenty similar screens are simple but not small.
- Uncertainty - how confident the team is that it understands the work. Unknowns inflate estimates, and they should.
Because points are relative, they only mean something inside one team's history. A "5" on your team is calibrated against your codebase, your definition of done, and your people. Comparing points across teams - or worse, using them for cross-team capacity planning - produces numbers that look precise and mean nothing.
The relative framing is the entire trick. People are demonstrably bad at predicting absolute durations, but consistently decent at comparisons: everyone who has moved house can tell you the sofa is harder than the lamp without knowing how long either takes. Story points bank on that skill.
Where story points came from
Story points grew out of Extreme Programming in the late 1990s. XP teams originally estimated in "ideal days" - time with zero interruptions - and then noticed that stakeholders kept hearing "days" and treating the fiction as a calendar commitment. Abstracting the unit into a pointscale broke that false equivalence. Ron Jeffries, one of the founders of XP, has written that story points likely evolved this way on the original XP teams - and has famously mixed feelings about how the industry has used them since.
Two other names matter for the history:
- James Grenning invented Planning Poker in 2002 as a fast, anchoring-resistant way for a team to converge on point estimates.
- Mike Cohn of Mountain Goat Software popularized both points and Planning Poker through Agile Estimating and Planning (2005), still the standard book on the topic. (Planning Poker® is a registered trademark of Mountain Goat Software; the technique is also widely called Scrum Poker.)
One fact worth knowing because it surprises almost everyone: the Scrum Guide does not mention story points at all. Scrum requires that backlog items be sized, but the technique - points, t-shirt sizes, or simply counting items - is left entirely to the team. Story points are a convention, not a rule.
Story points vs hours
The most common question about points is why not just use hours. The short answer: hour estimates imply a precision that doesn't exist and individualize what are usually system problems. The full argument is in story points vs hours; the comparison in brief:
| Story points | Hours | |
|---|---|---|
| What they measure | Relative effort vs. other stories | Predicted calendar time |
| Precision implied | Honest ("bigger than a 3") | False ("6 hours" under perfect conditions) |
| When wrong | Team recalibrates the scale | Someone explains themselves |
| Cross-team comparison | Meaningless by design | Misleading but tempting |
| Feeds | Velocity-based sprint planning | Gantt-style scheduling |
| Fails when | Treated as a commitment | Reality includes interruptions |
Hours still have legitimate uses - detailed task plans and billing - but for sprint planning and backlog sizing, relative units fit the actual shape of the uncertainty.
The Fibonacci scale, and why the gaps grow
Most teams estimate on a modified Fibonacci sequence: 0, 1, 2, 3, 5, 8, 13, 21, usually with a ? card for "no idea." The widening gaps are the point. Estimation error grows with size - nobody can meaningfully distinguish a 12 from a 13, so a good scale refuses to ask. As work gets bigger, your choices get coarser, which keeps the debate where it's useful (is this a 5 or an 8?) and kills the debates that aren't (is this a 6 or a 7?).
The same intuition appears in psychophysics as the Weber-Fechner effect: humans perceive differences proportionally, not absolutely. A 2 and a 3 feel meaningfully different; a 20 and a 21 don't.
Rough working meanings that many teams converge on:
| Points | Typical meaning |
|---|---|
| 1 | Trivial, well-understood change |
| 2-3 | Small story, clear path, few unknowns |
| 5 | Solid day-plus of work, or smaller work with real unknowns |
| 8 | Large story - fine to carry, worth asking if it splits |
| 13 | Upper limit of comfortable; usually hides a seam to split along |
| 21 / ? | A signal, not an estimate: the story is too big to size |
These are illustrations, not standards - your team's 5 is defined by your team's history, nothing else.
Alternative scales
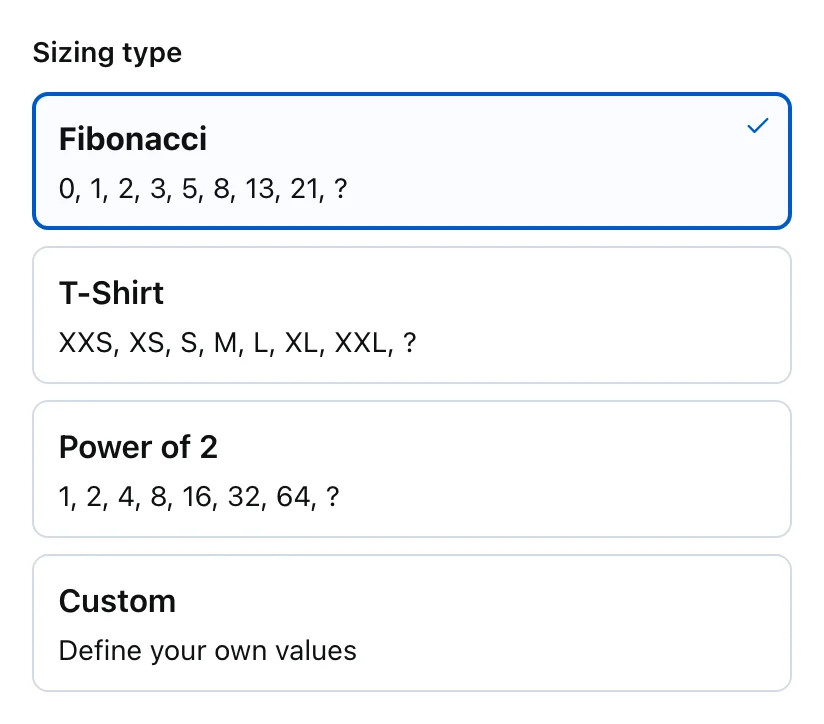
Fibonacci is the default, not the law:
- T-shirt sizes (XS-XXL) trade precision for speed - ideal for roadmap-level sizing where debating 5-vs-8 is theater. See Fibonacci vs t-shirt sizing and the t-shirt estimation page.
- Powers of 2 (1, 2, 4, 8, 16) make the "no false precision" property even more aggressive.
- Custom decks suit teams with an established house scale.
All four are built into Rolia Estimation's deck picker, so switching scales between meetings costs nothing.
Starting a baseline: your reference story
Points mean nothing until the team anchors them to real work. The bootstrap process:
- Pick a reference story. Choose one recently completed story that everyone understands and that felt genuinely medium - not trivial, not a monster. Declare it your 3 (or 5).
- Estimate everything relative to it. For each new story, the question is never "how long will this take?" but "is this bigger or smaller than the reference?"
- Keep the reference visible for the first few sessions - in the story description, the team wiki, wherever the team will actually see it.
- Let it fade. After a handful of sessions, the team internalizes the scale and stops needing the explicit comparison.
The full practice, including when and how to re-anchor, is in calibrating your estimation scale. Recalibration matters most when new members join - they bring different intuitions about what "hard" means - and after major codebase changes, when what used to be a 3 in the old system might honestly be an 8 in the new one.
How do you "calculate" story points?
The honest answer to the most-searched question about points: you don't calculate them - you compare. There is no formula that takes inputs and produces a point value, and any spreadsheet that claims otherwise ("complexity × 2 + risk × 1.5") is hour-estimation wearing a costume. What teams actually do:
- Read the story and its acceptance criteria.
- Find its nearest neighbors in work the team has already completed: "this is like the export feature we built, but with an unfamiliar API."
- Adjust for the three ingredients - more complex, more volume, or more uncertain than the neighbor pushes the estimate up a step on the scale; less pulls it down.
- Vote as a team and let the spread expose disagreements.
The comparison step is why estimation gets faster and better over time: every completed sprint enlarges the library of neighbors. It's also why a brand-new team's first estimates are little more than structured guesses - there's nothing to compare against yet, which is fine, as long as nobody treats sprint-one numbers as data.
If you want arithmetic, it belongs after estimation, not during: summing points per sprint gives velocity, and dividing the remaining backlog by velocity gives a rough forecast horizon. That's the entire mathematics of story points.
(That said, if you want a structured starting card for a story before the team votes, the story point calculator walks through exactly the three-ingredient comparison above.)
Who votes, and who doesn't
Points measure delivery effort, so the people who deliver cast the votes - and estimation sessions go sideways when that boundary blurs:
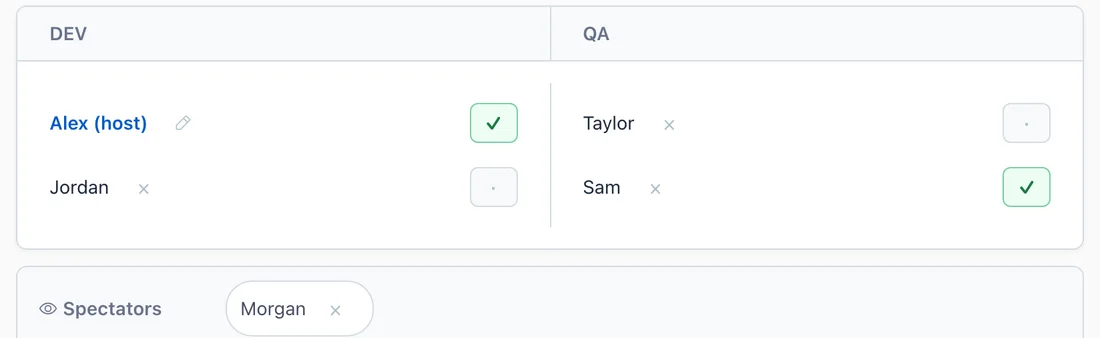
- Developers vote. Anyone who will build, test, or review the work belongs in the vote. Junior votes count exactly as much as senior ones - a junior's honest 8 against a senior's 3 is precisely the conversation the technique exists to surface.
- The Product Owner clarifies but doesn't vote. The PO is the authority on what the story requires, not how hard it is. A PO who says "I think this is a 3" isn't estimating - they're anchoring. The full etiquette is in the Product Owner's role in planning poker.
- Other stakeholders answer questions. Business stakeholders in the room can resolve scope questions in seconds instead of days, but they shouldn't hold cards - and if their presence visibly compresses estimates, share results with them instead of seats.
- Designers are a genuinely harder call. Design complexity and implementation complexity are different dimensions; the options range from separate vote tracks to discussion-only participation.
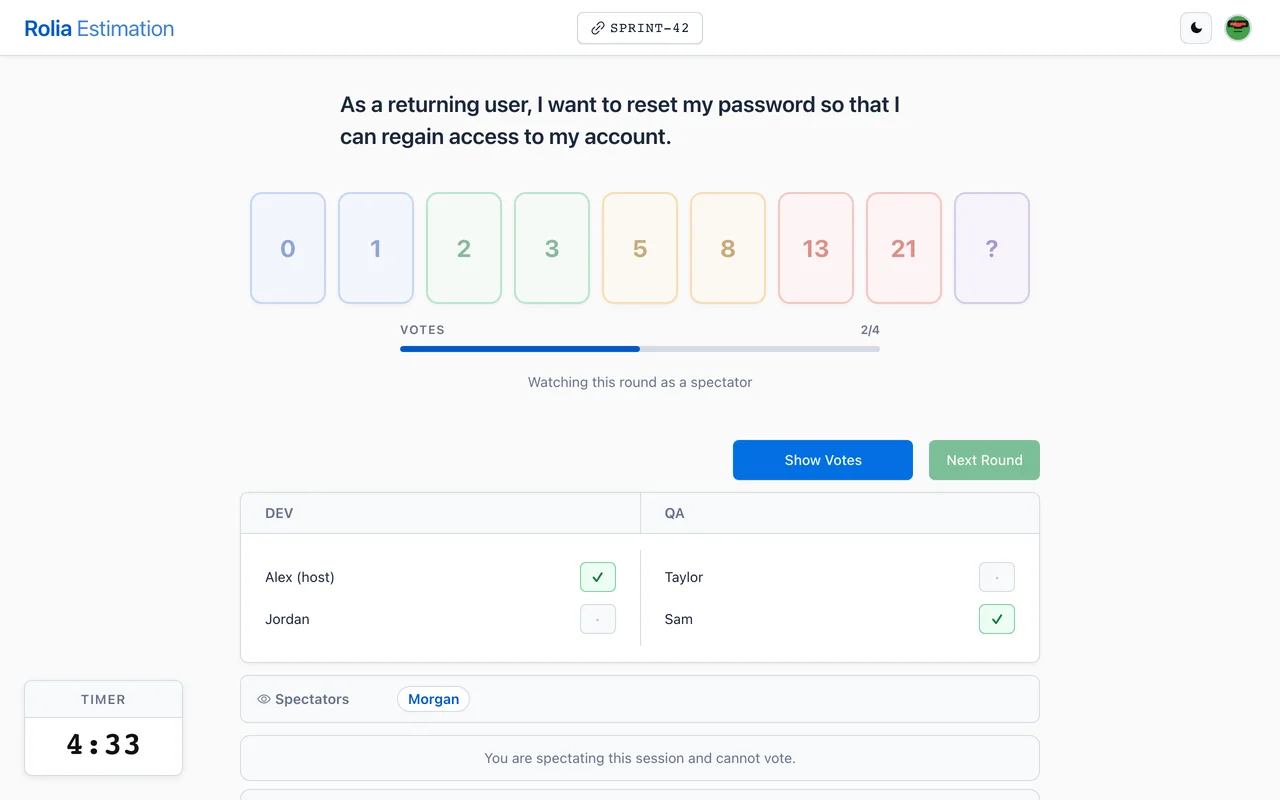
This is why role support matters in tooling: Rolia Estimation lets participants join as Dev, QA, or PO, and non-voting observers can follow along in spectator mode without touching the results.
How a team assigns points: the estimation session
Points are a team property, so the number has to come from the whole team - not the loudest senior engineer. The standard mechanism is Scrum Poker: everyone estimates in private, all votes are revealed simultaneously, and disagreement drives discussion. The private-then-simultaneous structure exists to defeat anchoring bias - once someone says "feels like a 5" out loud, every subsequent estimate drifts toward 5.
A round in practice:
- The facilitator reads the story and its acceptance criteria aloud.
- Everyone privately picks a card. No discussion before voting.
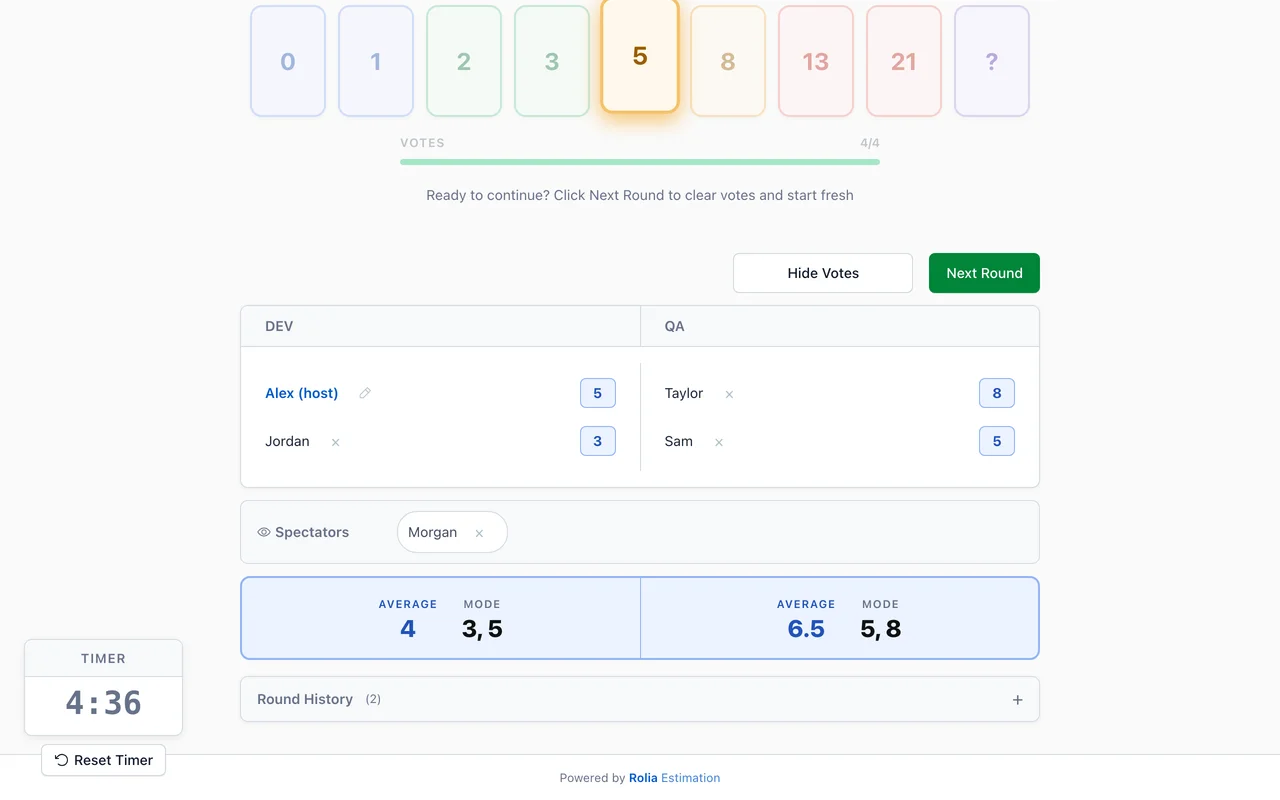
- All cards are revealed at once.
- Consensus? Record the estimate and move on - agreement needs no meeting.
- Spread? The highest and lowest voters explain their reasoning - the high voter usually spotted a risk, the low voter often knows a shortcut. Then re-vote once.
- Still split after two or three rounds? Stop voting - you have a knowledge or scope problem, not an estimation problem. Park the story for refinement or split it.
If you've never facilitated one of these, the first-session walkthrough covers setup and the classic first-timer mistakes. Remote teams have their own failure modes - voting in chat is anchoring with extra steps - covered in remote sprint planning tips and on the remote teams page.
A worked example
Five stories from a hypothetical checkout team, with the reasoning a real session might surface:
| Story | Votes | Discussion | Final |
|---|---|---|---|
| Add "save card for later" checkbox | 2, 2, 3, 2 | Near-consensus; the 3 worried about the consent copy. Not enough to argue about. | 2 |
| Support Apple Pay | 5, 8, 8, 13 | The 13 knew the payment provider's sandbox doesn't cover it; testing risk is real. High voter's risk accepted. | 8 |
| Fix rounding bug in cart totals | 3, 3, 3, 3 | Instant consensus - known cause, known fix. | 3 |
| Migrate checkout to new API gateway | 8, 21, 13, ? | The ? and 21 signal unknown scope. Not estimable - converted to a spike plus a delivery story to size after. | spike |
| Show delivery ETA on confirmation | 3, 5, 3, 5 | The 5s assumed a new carrier API call; the 3s knew the data was already in the response. Re-vote after clarification: unanimous. | 3 |
Note what the process caught: one hidden testing risk, one unestimable story stopped before it poisoned a sprint, and one misunderstanding about existing data resolved in two minutes. The numbers are almost a by-product - the conversation is the value.
After the reveal, the spread, average and consensus are worth recording. Rolia Estimation keeps a round history with CSV export so estimates survive the meeting and feed retrospectives.
From points to plans: velocity
Velocity - points completed per sprint - is how estimates become forecasts. After three or four sprints, a rolling average gives you a defensible basis for the next sprint's commitment: if the team has averaged 32 points, committing to roughly 30 is planning; committing to 45 is hoping. The mechanics - rolling windows, capacity adjustments for leave and holidays, what a sudden drop means - are in using historical velocity.
Velocity comes with a warning label. It's a planning input, and the moment it becomes a productivity target, teams rationally inflate estimates and the number stops meaning anything - the full failure mode is documented in why velocity is a poor productivity metric. Answering stakeholders' "how long will this take?" honestly means converting average velocity to calendar time with a buffer - not summing invented hour estimates.
How big should stories be?
A healthy, refined backlog has a recognizable shape: most sprint-ready stories land between 2 and 8 points, with the occasional 1 and the occasional 13. If your distribution looks different, it's usually telling you something:
- Everything is a 1 or 2. Either the team splits obsessively (fine - some teams deliberately cut all work to near-uniform size, at which point counting stories beats pointing them), or the scale has drifted and needs re-anchoring.
- Lots of 13s and 21s entering sprints. Stories are arriving under-refined. Big estimates are fine in the deep backlog; by the time work enters a sprint, anything above 8 deserves the question "where does this split?" The patterns - by workflow step, by user role, by happy path vs. edge cases - are in splitting user stories.
- Wide spreads on most stories. The problem is upstream: acceptance criteria aren't nailed down before estimation. That's a refinement and Definition of Ready fix, not an estimation fix.
Don't split stories just to hit a points threshold, though - a genuinely indivisible 8 is a legitimate 8. Artificial splits create coordination overhead without reducing any actual complexity.
Team size shapes the distribution too: small teams converge fast (sometimes on shared blind spots), large groups suppress honest outlier votes. The dynamics and fixes per team size are covered in how team size affects estimation accuracy.
What the research says
Story points rest on two empirical claims, both with support in the software-engineering literature:
- People compare better than they predict. Decades of estimation research - much of it by Magne Jørgensen and colleagues at Simula Research Laboratory - documents how unreliable absolute effort predictions are, and how strongly they're skewed by irrelevant anchors: exposure to a low number before estimating measurably drags estimates down, even when estimators know the number is irrelevant. Relative scales and hidden voting are direct countermeasures.
- Structured group estimates beat mechanically averaged individual ones. Group-estimation studies (Moløkken-Østvold and Jørgensen among others) found that discussion-based group estimates were less optimistic and more realistic than simply averaging individual guesses - the discussion surfaces work that individuals overlook. That's the "planning" in planning poker: the argument between the 3 and the 13 is where the missing requirements appear.
The practical reading: the ritual isn't decoration. Private voting, simultaneous reveal, and outlier-led discussion each counter a specific, documented bias. Strip them away - votes in a chat thread, the loudest voice first - and you keep the ceremony while losing the mechanism, which is how teams end up concluding that estimates just don't work.
Edge cases: bugs, spikes, and debt
Feature stories have acceptance criteria; other work resists the same treatment:
- Bug fixes hide their scope until you've found the root cause. Classify by confidence - known cause/known fix estimates like a small feature, unknown cause gets an investigation timebox first. Framework in estimating bug fixes.
- Spikes produce knowledge, not code, so don't point the outcome - timebox the investigation. Details in estimating spikes and research tasks.
- Technical debt usually starts from "we don't know how bad it is," which is a spike-then-estimate pattern too: estimating technical debt.
The mistakes that make points meaningless
Every failure of story points in the wild traces back to a handful of patterns - the full catalog is in common planning poker mistakes and estimation anti-patterns, but the big four:
- Points as commitments. The moment an estimate is a promise, people stop estimating and start negotiating. Estimates are forecasts; sprint commitments are a separate conversation.
- Points as hours in disguise. Any per-story conversion ("1 point = 4 hours") reintroduces exactly the false precision points exist to remove.
- Cross-team comparison. Each team's scale is calibrated to its own history; comparing them ranks nothing but noise.
- Estimating the unready. Stories without acceptance criteria produce wide spreads because everyone is estimating a different imaginary story. A Definition of Ready gates that before the meeting.
And when estimates keep missing in the same direction anyway, that's a process signal, not a skill problem - the diagnosis guide is why your estimates keep being wrong, and the compounding damage of ignoring it is covered in the hidden cost of inaccurate estimates.
When to skip story points
Points are a means to reliable sprint planning, not a loyalty test. Very small teams with constant communication, teams whose stories are all roughly the same size, and continuous-flow Kanban teams often get nothing from them - counting stories and tracking cycle time works fine. The honest decision framework is in when to skip story points.
If you keep points, keep them cheap: a well-run session estimates a refined backlog in minutes, not hours. Estimation that regularly eats an afternoon isn't rigorous - it's an anti-pattern with a calendar invite.
Try it with your team
Reading about relative estimation is like reading about swimming. The fastest way to make points concrete is one real session: pick five stories, get the team in a room (or a link), vote privately, reveal together, and argue only about the spreads. You can create a free Scrum Poker room with the Fibonacci deck in a few seconds - no accounts, no setup, up to 50 participants.